Built for Microsoft Entra ID

See inside your Microsoft Entra ID, before it surprises you.

VisualizerEngine turns your Entra ID groups, nesting, and license assignments into a live, interactive map, so you can find the circular references, misplaced licenses, and policy drift that the Azure portal never shows you.

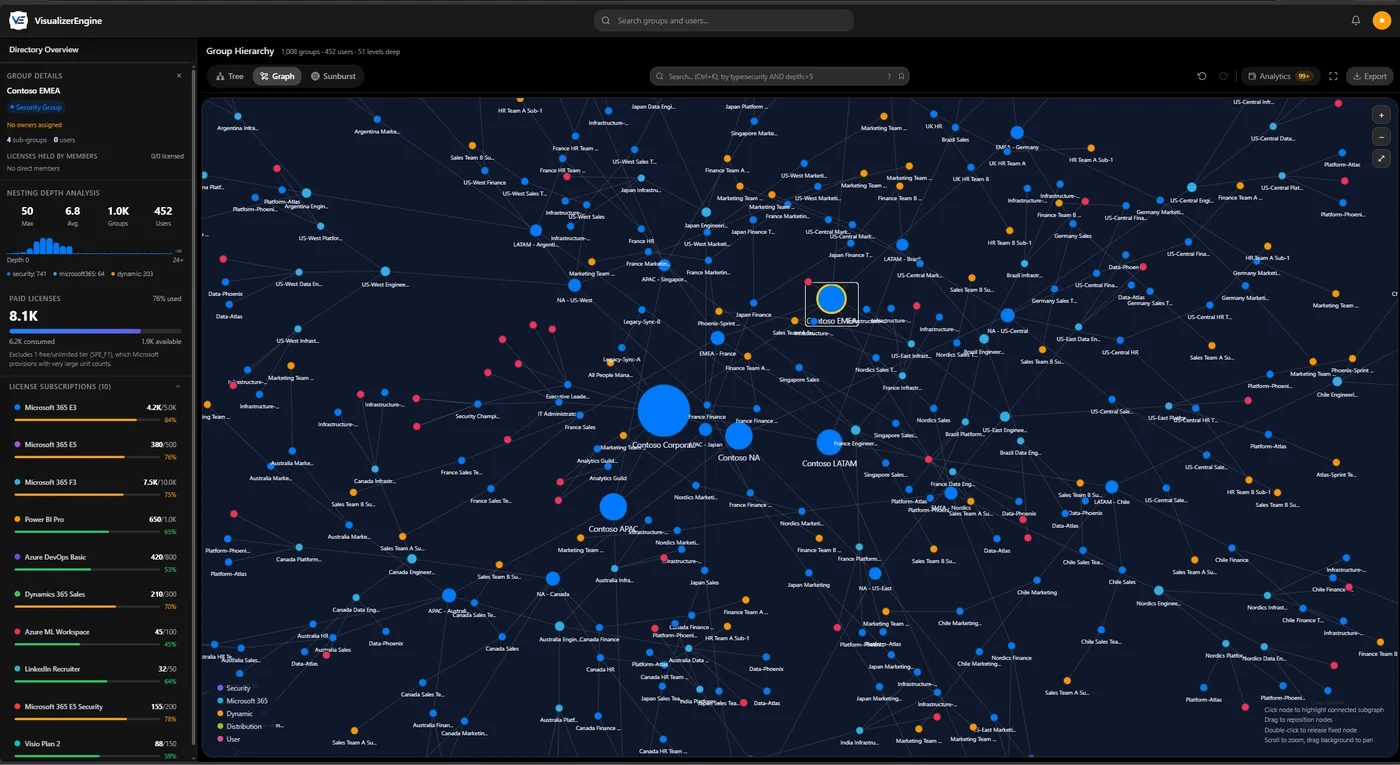
The VisualizerEngine workspace in dark mode on a demo directory of 1,008 groups and 452 users nested 51 levels deep: the full force-directed graph of the tenant colored by group type, with group details for a selected security group, nesting depth analysis, paid license usage, and ten license subscriptions in the left sidebar
Actual product screenshot, demo directory.
Access model
Read-only Graph permissions
Performance-verified
50,000 groups · 250,000 memberships
Isolation
Row-level security, enforced in the database
Sign-in
Entra ID single sign-on, no passwords

01The problem

Your directory has a shape. Microsoft never shows it to you.

Every Entra ID tenant grows the same way: groups get nested inside groups, licenses get assigned to groups, people inherit access through chains nobody remembers building. The Azure portal shows you flat lists. It cannot answer the questions that actually decide your risk and your spend.

Two engineers working side by side at a bank of monitors
Fig. 01The questions arrive faster than the portal can answer

"Why does this user have an E5 license, and why doesn't that one?"

Group licensing and group access follow different rules. Access flows through nested membership, but Entra grants a group license only to that group's direct members. Nest a team under a licensed parent group and nobody in that team gets licensed. It is a documented Microsoft limitation that catches even experienced admins, and the portal never shows you which of your groups it is quietly biting.

"What happens if I move this group?"

There is no undo button in a directory. Moving a group changes access for every member nested beneath it, and you usually find out who lost access when the support tickets arrive.

"Is anything circular, orphaned, or nested too deep?"

Circular nesting, abandoned groups, and runaway depth pile up silently over the years. Nothing in the native tooling flags them for you.

"What changed since last month?"

Directories drift constantly. Without point-in-time snapshots you cannot prove what changed, when it changed, or whether you are still inside your own rules.

"How much license money are we wasting?"

Duplicate assignments, disabled service plans, and unused seats all hide inside the same invisible structure.

The status quo

Today, IT teams answer these questions with PowerShell scripts, exported spreadsheets, and the memory of whoever has been there longest. VisualizerEngine answers them with a picture, in seconds.

02The solution

Not another report. A living map of your directory.

An Entra ID visualizer built for enterprise tenants. VisualizerEngine mirrors your directory through read-only Microsoft Graph permissions, then makes its structure visible, testable, and provable, from everyday IAM questions to identity governance evidence.

See the structure

Explore nesting, memberships, and license flows as an interactive hierarchy, graph, or sunburst, instead of flat lists.

Test the change

Simulate group moves and license changes inside VisualizerEngine, and see the full blast radius before the directory is touched.

Prove the history

Capture snapshots, diff any two points in time, score policy compliance, and export reports that carry provenance metadata.

03Features

Everything the portal cannot show you

Nine capabilities, one live mirror of your directory, told in the order you will actually use them. Explore all features in depth.

See it

Three ways to see your directory

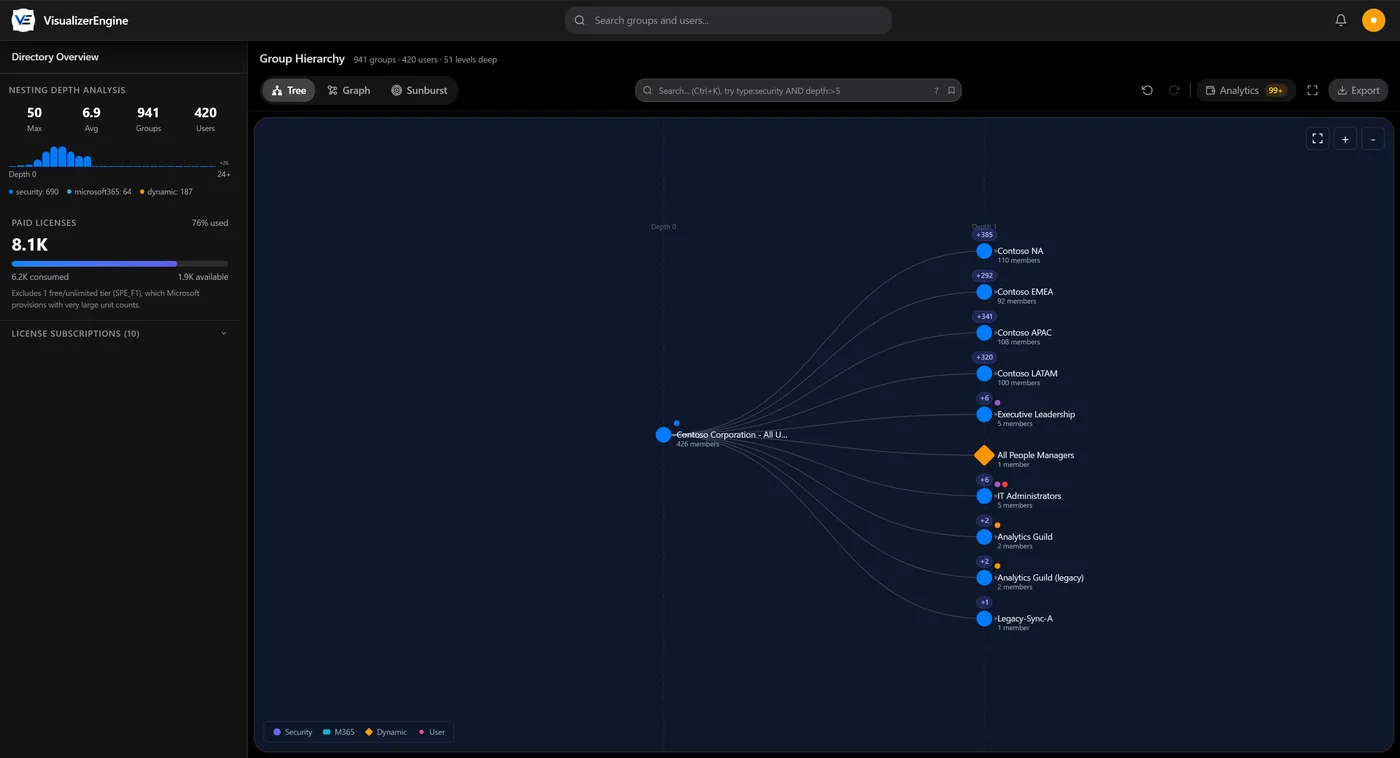
The same live directory as an interactive hierarchy tree, a force-directed graph, or a sunburst chart. Switch between them instantly and zoom from the whole tenant down to a single membership connection.

VisualizerEngine force-directed graph in dark mode: hundreds of demo directory groups clustered by connection and colored by type, with the nesting depth histogram and license usage in the sidebar
The graph view. Actual product screenshot, demo directory.

Understand it

Nesting intelligence and license truth

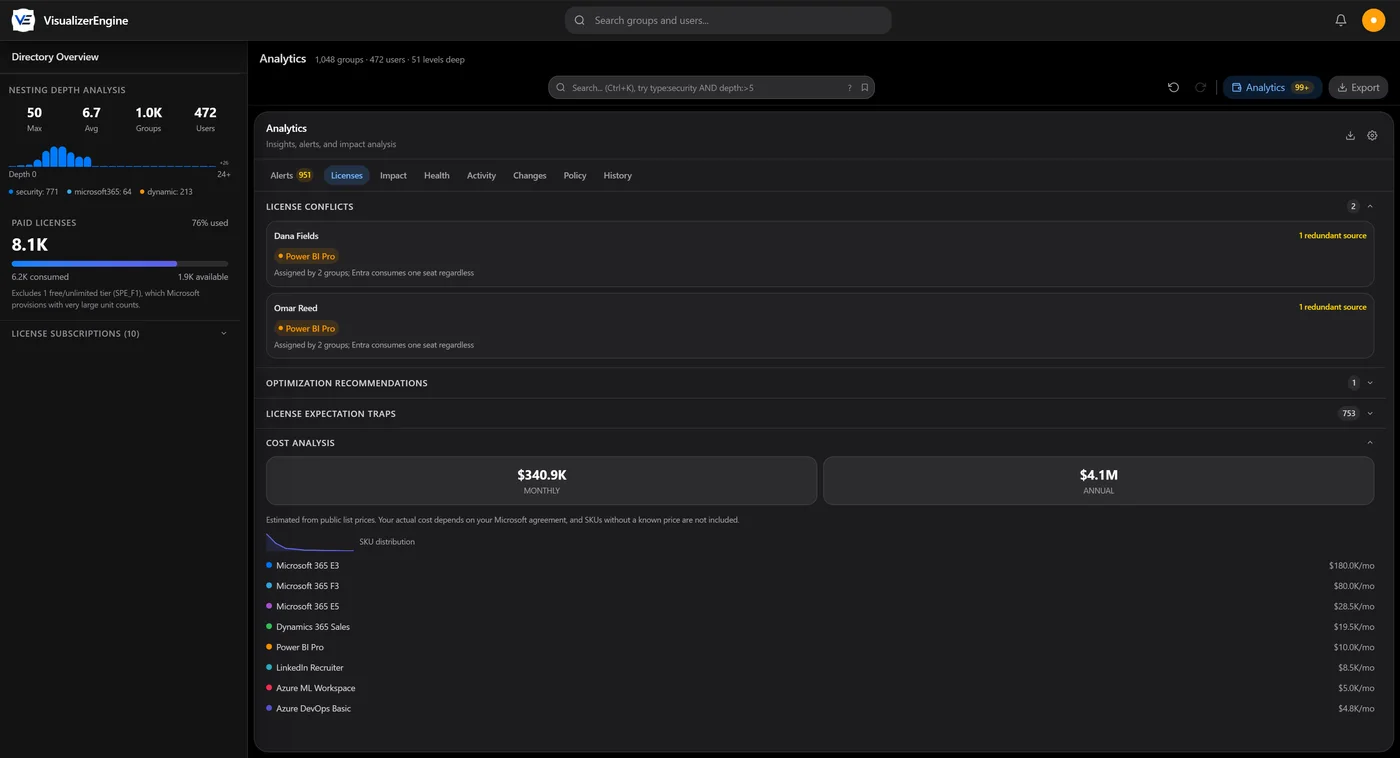
Circular references, depth violations, orphans, and overlapping groups are detected continuously and ranked. License analytics show every real source per user, cost by license and by group, duplicates, and the nesting license trap: every place where a license is assigned to a parent group but, per Entra's rules, never reaches the people nested below.

License analytics in dark mode: redundant-source license conflicts for two users, optimization recommendations, 753 license expectation traps, and a cost analysis of 340.9K dollars monthly across ten SKUs
Actual product screenshot, demo directory.
Closeup of the cost analysis: 340.9K dollars monthly and 4.1M dollars annual, estimated from public list prices

Change it safely

Simulate before you touch production

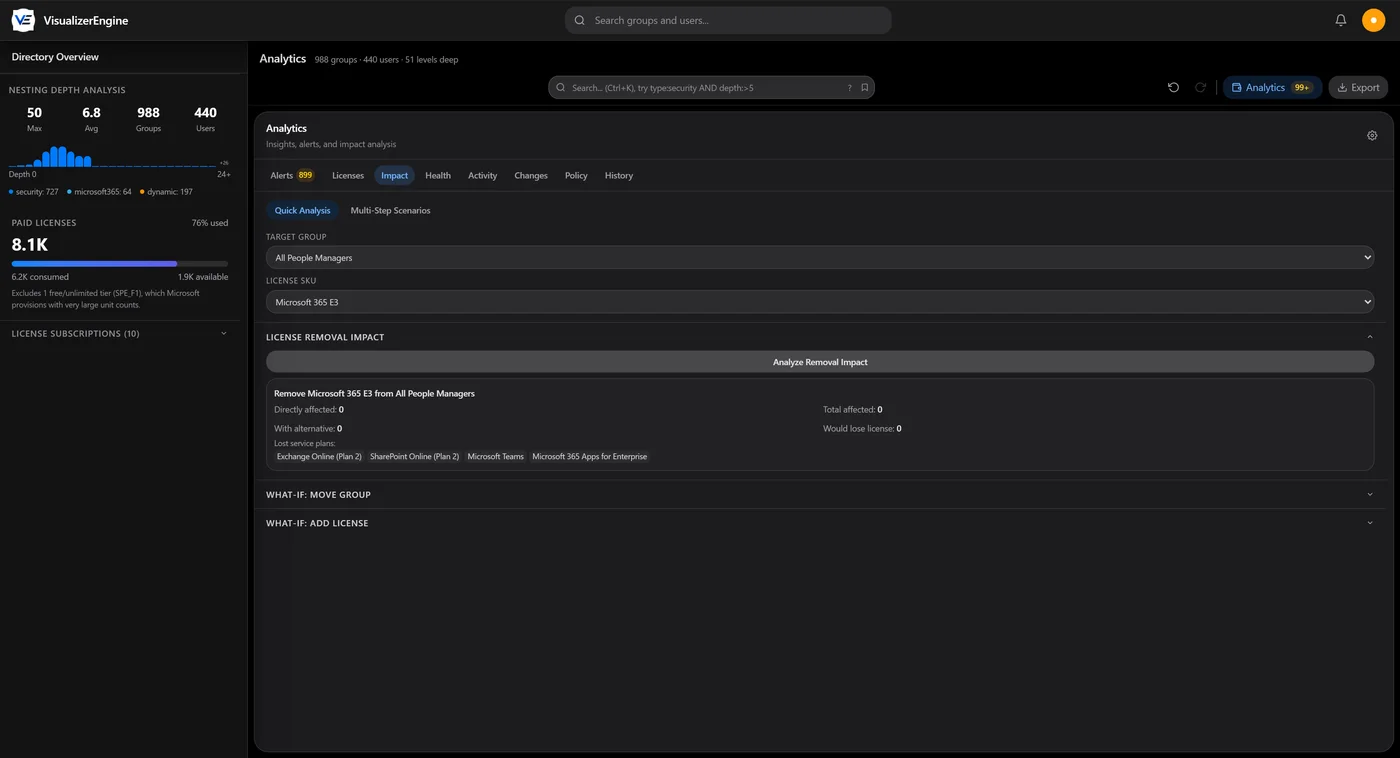
Model a group move or a license change first. Every simulation shows the full blast radius, who gains access, who loses it, and what happens to licensing, then generates an ordered implementation plan, all without making a single change in production.

What-if simulation: analyzing removal of Microsoft 365 E3 from a target group, showing directly affected members, members with alternative coverage, and the service plans that would be lost
Actual product screenshot, demo directory.
Closeup of the removal impact summary: directly affected members, alternative coverage, and the service plans that would be lost

Govern it

Policies, snapshots, and change awareness

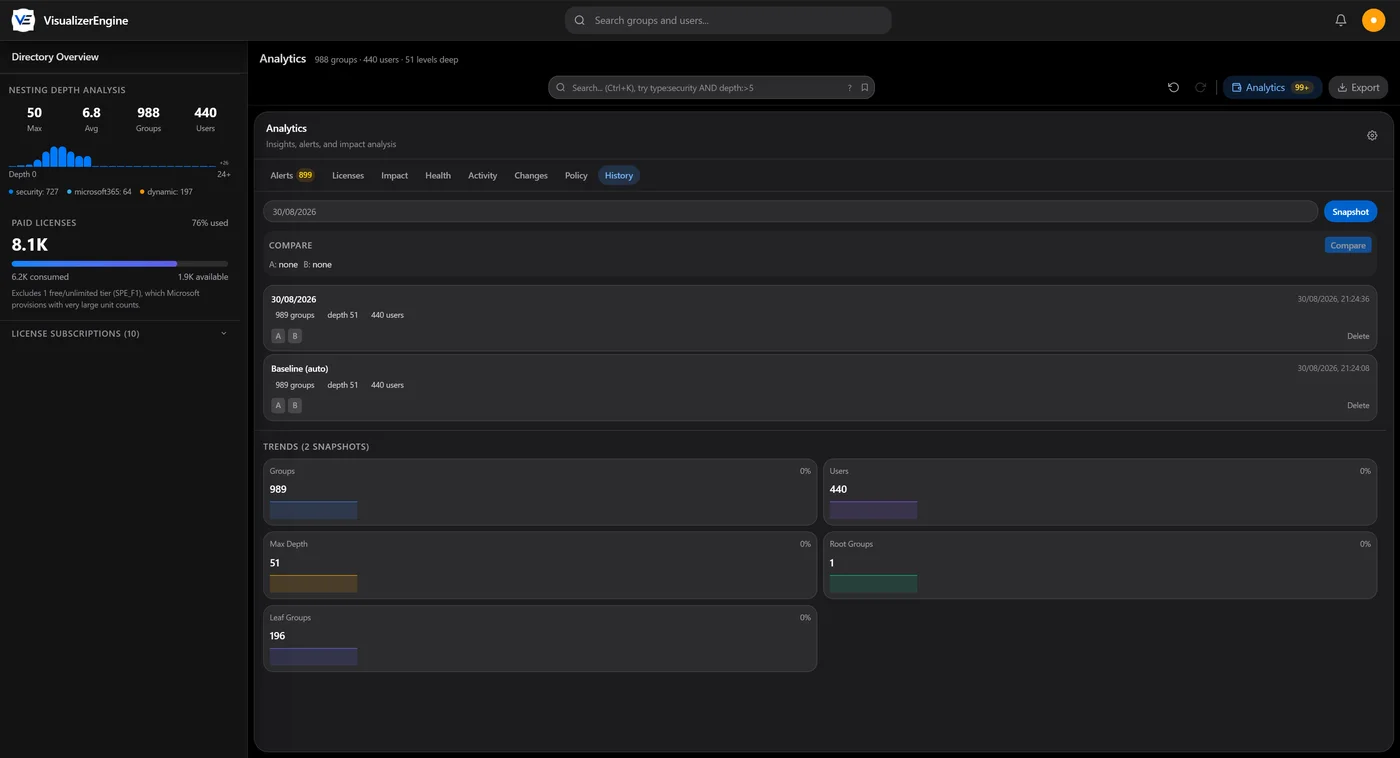
Encode your structural rules and watch a live compliance percentage instead of dreading the audit. Point-in-time snapshots diff into exact change lists, and a notification center with a change-history view means the directory stops changing behind your back.

Policy compliance in dark mode: a 33 percent compliance score gauge with violation counts by severity, per-rule violation totals for the Microsoft best practices template, and the full ranked violation list
Actual product screenshot, demo directory.
Closeup of the compliance score gauge: 33 out of 100, with one critical, 896 high, 726 medium, and 1,013 low findings

Work it daily

Search, reporting, and honest exports

A focused search language answers the questions you ask every week, saved for one-click reuse. Exports cover every audience: CSV and JSON, branded PDF reports, images of any view, and compliance exports with provenance. And when any part of the directory cannot be fully read, every figure is plainly marked as a lower bound.

The export menu open over analytics: PNG, SVG, JSON, and CSV quick export, CSV column selection, and SOC 2 and ISO 27001 compliance mapping exports plainly labeled as unaudited audit inputs
Actual product screenshot, demo directory.
Closeup of structural search results: a table of one hundred matches with name, type, depth, members, and licenses

04How it helps your company

From invisible structure to measurable outcomes

A team in a conference room reviewing a presentation on a wall screen
Fig. 02Outcomes you can put in front of the board

Cut wasted license spend

Duplicate assignments, unused seats, and disabled service plans are easy to miss in a spreadsheet and obvious on a map. Find the spend you can recover, and prove the savings before you change anything.

Stop access surprises before they happen

Simulate group moves and license changes and see who gains or loses access first, so a routine cleanup does not become an outage or a security gap.

Close a real security blind spot

Circular nesting, orphaned groups, and over-deep hierarchies are the quiet conditions that let access sprawl. Seeing them is the first step to fixing them.

Pass access reviews and audits faster

Point-in-time snapshots, a provable change history, and traceable compliance exports turn a stressful audit into a report you already have.

Onboard new administrators in hours, not months

A new hire understands your group structure by looking at it, instead of absorbing years of tribal knowledge.

Replace fragile scripts with a shared tool

The PowerShell that lives on one person's laptop becomes a live, shared picture the whole team can use and trust.

05Security

What we actually enforce

Attackers already see your directory as a graph. It is time you did too. Every control listed on this site exists in the platform today, and controls we do not provide are not claimed anywhere.

Two colleagues with a laptop walking a datacenter corridor between server racks
Fig. 03Your directory is infrastructure. Treat it that way.

Tenant isolation in the database

Every record is bound to a tenant, and the database refuses cross-tenant reads at the storage layer. Proven by automated tests, not merely promised.

Tamper-evident audit trail

Every administrative and read action is written to a cryptographically chained, append-only log. If anyone alters the record, the chain check detects it.

Least privilege everywhere

Read-only access to Microsoft Graph, database roles separated so the application cannot change its own security rules, and secrets kept out of the code.

06How it works

Live in three steps

  1. Consent

    A global administrator grants read-only consent through a standard Entra consent link. Nothing is installed and no agents run in your environment.

  2. Sync

    VisualizerEngine reads your directory once to build the picture, then keeps it current with Microsoft Graph change tracking.

  3. See

    The full nesting map, license sources, violations, and trends are live in your browser, ready to explore, simulate, and export.

07FAQ

Frequently asked questions

Does it modify my directory?

No. VisualizerEngine has read-only access to groups, users, and organization information. Every simulation runs inside the product and never writes to Entra.

Do I have to install anything?

No. It is a browser-based product reached through a single administrator consent link.

Can other tenants see my data?

No. Isolation is enforced at the database record level and covered by automated tests that confirm one tenant's administrators cannot read another tenant's data.

How big a tenant can it handle?

The read path is proven at 50,000 groups and 250,000 memberships, with performance that stays fast even deep into very large directories.

See your directory's real shape

VisualizerEngine is pre-launch. Onboarding is a read-only admin-consent link: no agents, nothing installed, nothing modified.