
Clarity at every level.
Explore the structure. Understand the licenses. Test the next move. One read-only mirror of your Entra ID directory brings it all together.
Three ways to see your directory
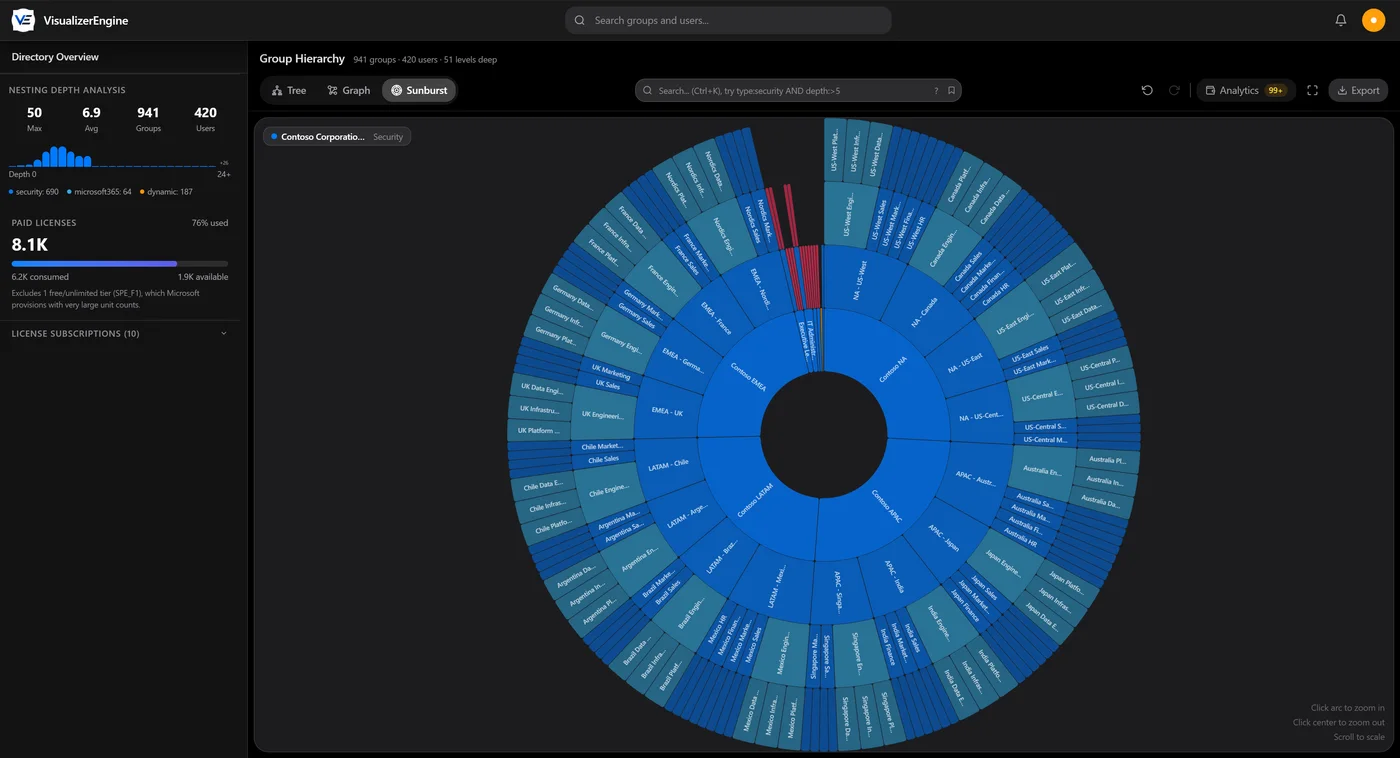
Turn 50,000 groups into one picture. Explore the same live directory as an interactive hierarchy tree, a force-directed graph, or a sunburst chart. Switch between them instantly and zoom from the whole tenant down to a single membership connection. Built for real organizations, with a read path proven at 50,000 groups and 250,000 memberships and page loads under a fraction of a second.
Find the structures that break tenants
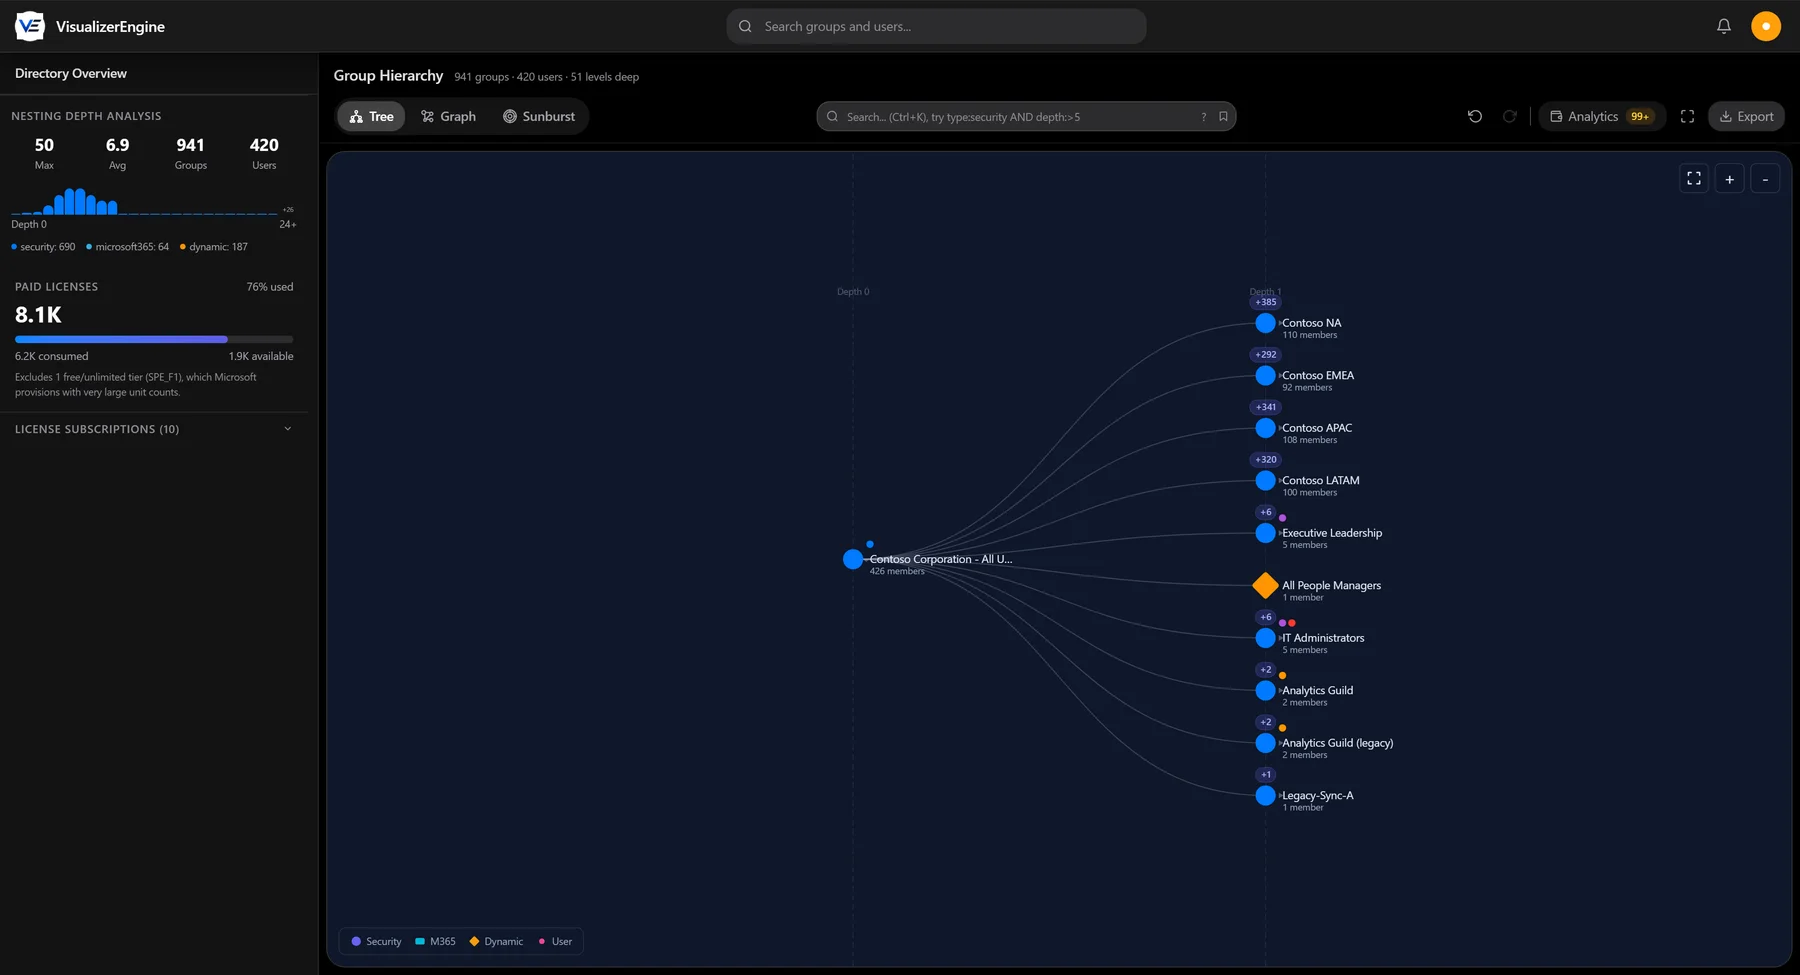
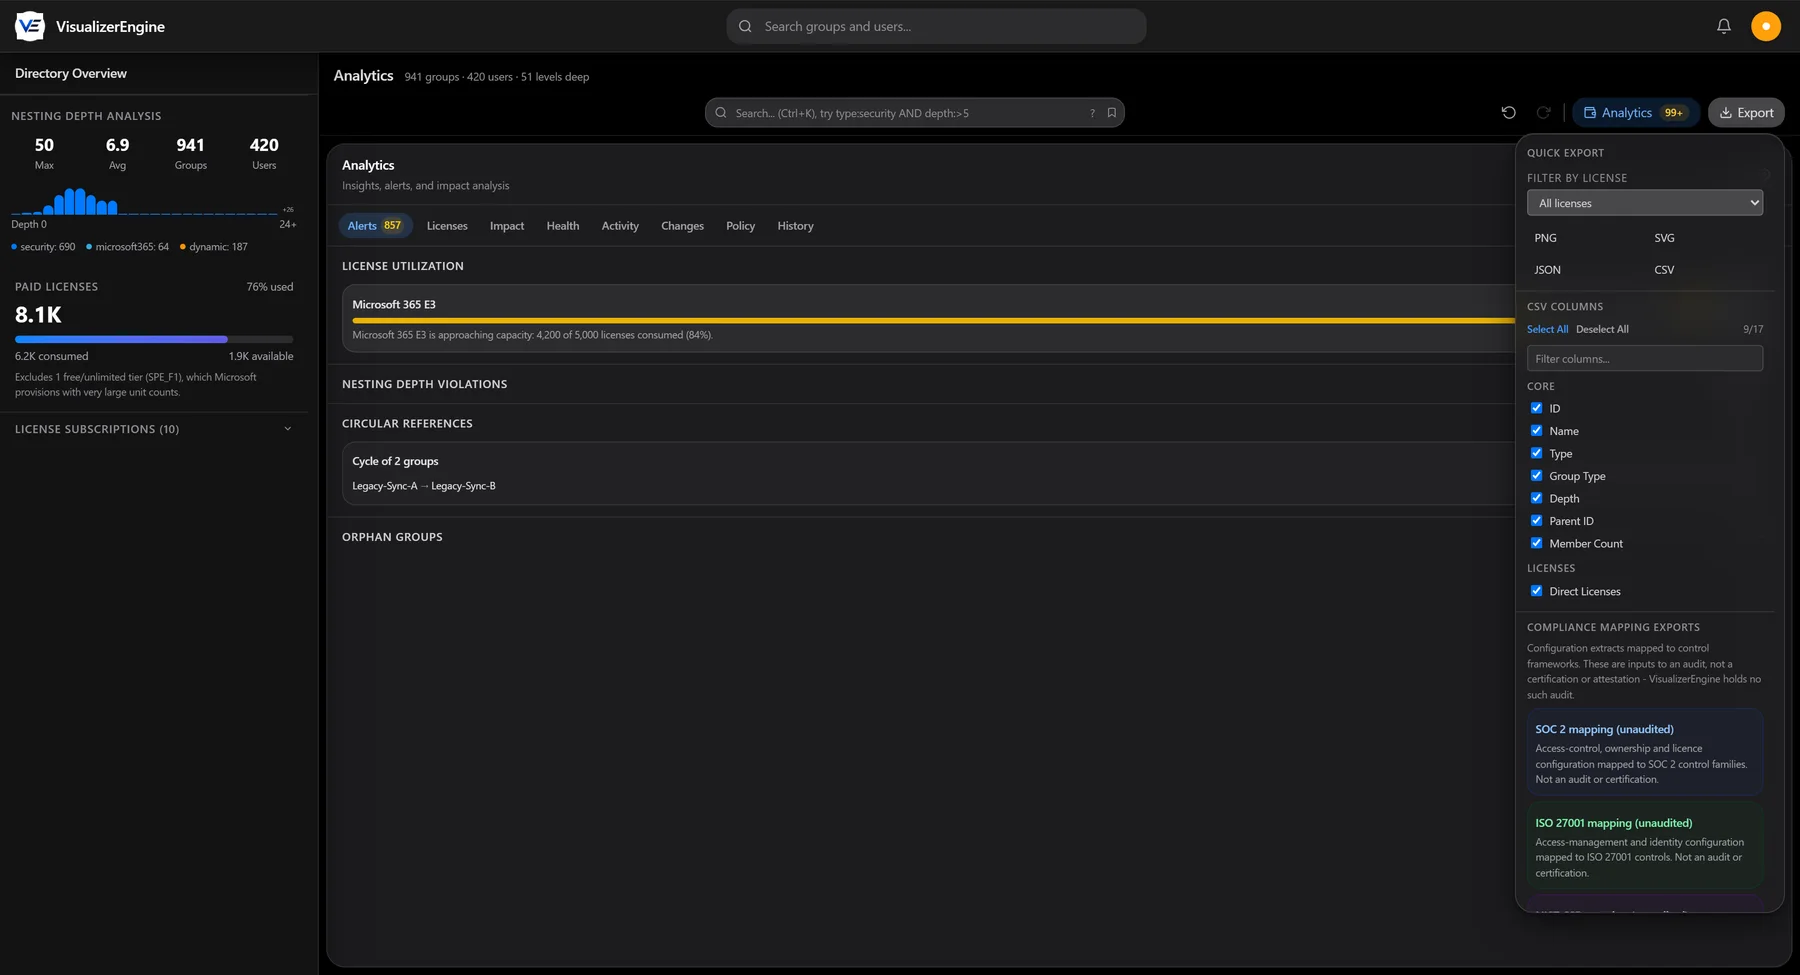
Every circular reference, orphaned group, and depth violation, in one view.
- Circular reference detection. Find membership loops before they break provisioning and confuse access reviews.
- Depth analysis against your own thresholds. Set the maximum nesting depth your organization allows, and see every group that breaks it, ranked by severity.
- Orphan detection. Surface abandoned groups: no parent, no children, or no members.
- Overlap detection. Spot pairs of groups whose memberships are nearly identical, a common sign of duplication that should be consolidated.
- Correct member typing. Users, devices, nested groups, service principals, and contacts are all told apart, so a device is never mistaken for a nested group and never inflates your nesting picture.
License analytics that tell the truth
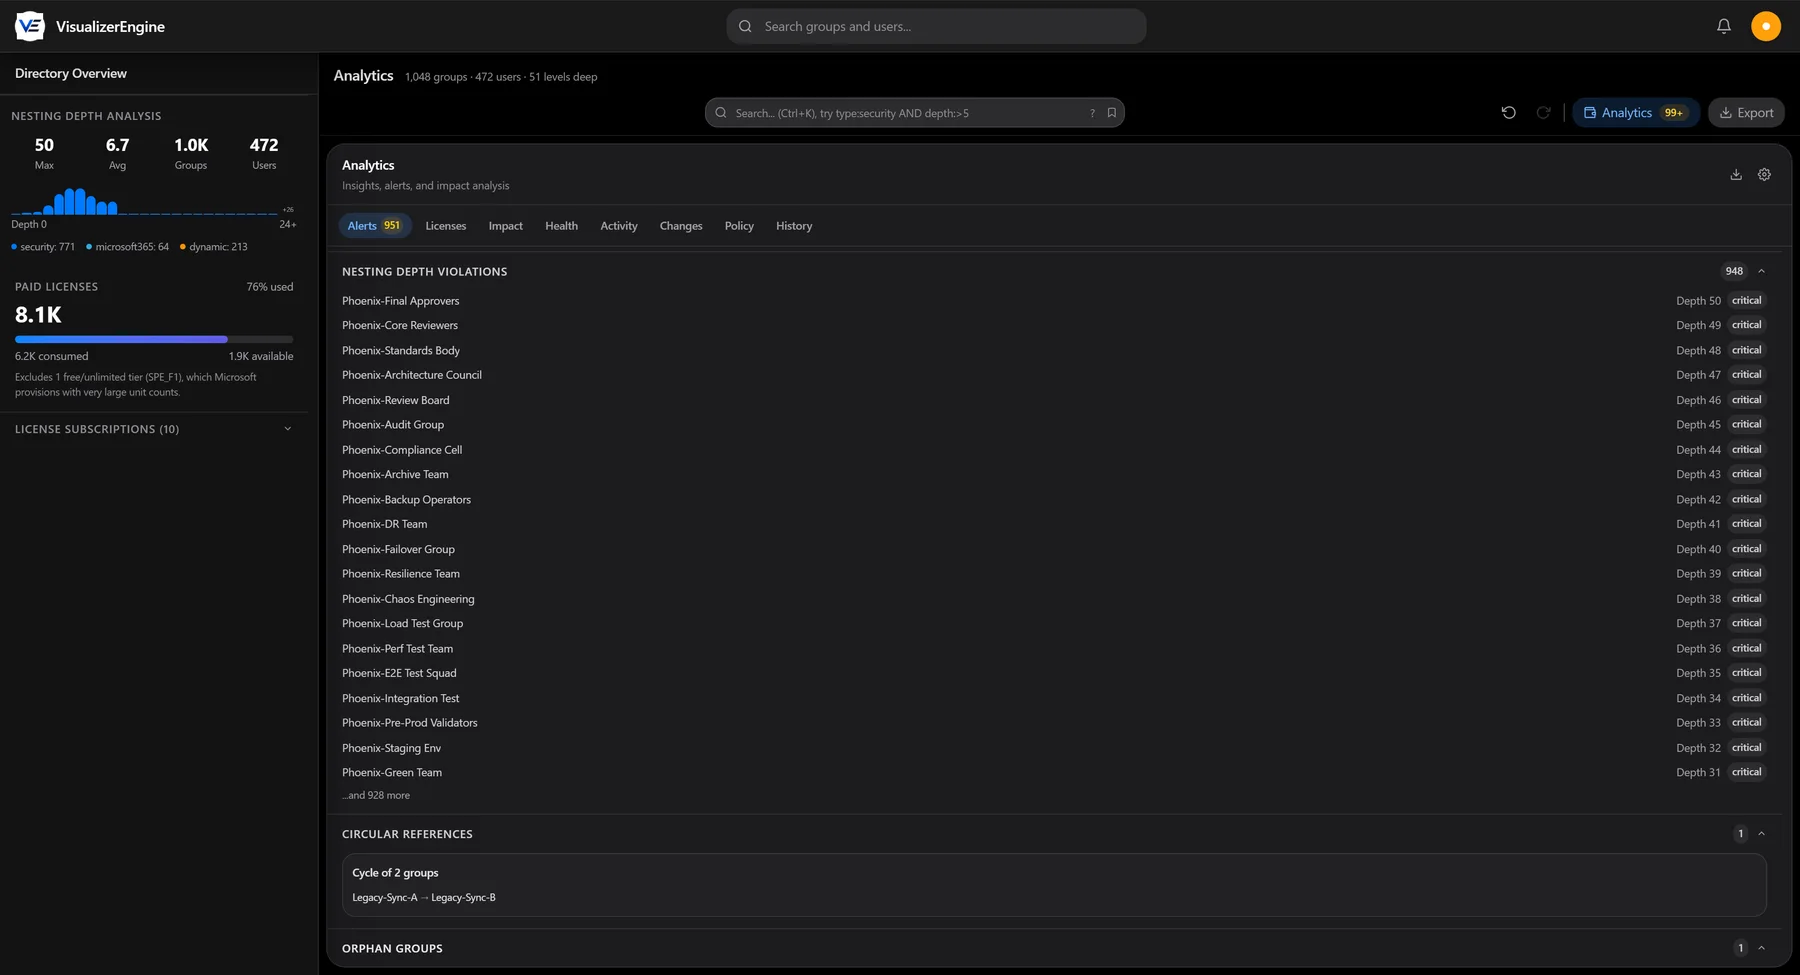
Trace any license to the exact source that granted it.
- License source mapping. For any user, see exactly where each license comes from: a direct assignment, or the specific group that grants it.
- The nesting license trap, made visible. VisualizerEngine flags every case where a license is assigned to a parent group and an admin would reasonably expect it to reach the people nested below, but Entra does not deliver it. This is the single most misunderstood behavior in Entra licensing, and this product is built to catch it.
- Cost analysis by license and by group. See where the money actually sits.
- Conflict and duplicate detection. Find users who receive the same license from more than one source, and disabled service plans tracked per assignment.
- Utilization alerts. Get warned as any license pool approaches or exceeds capacity.
- Optimization recommendations. Identify redundant assignments you can safely remove without taking a license away from anyone.
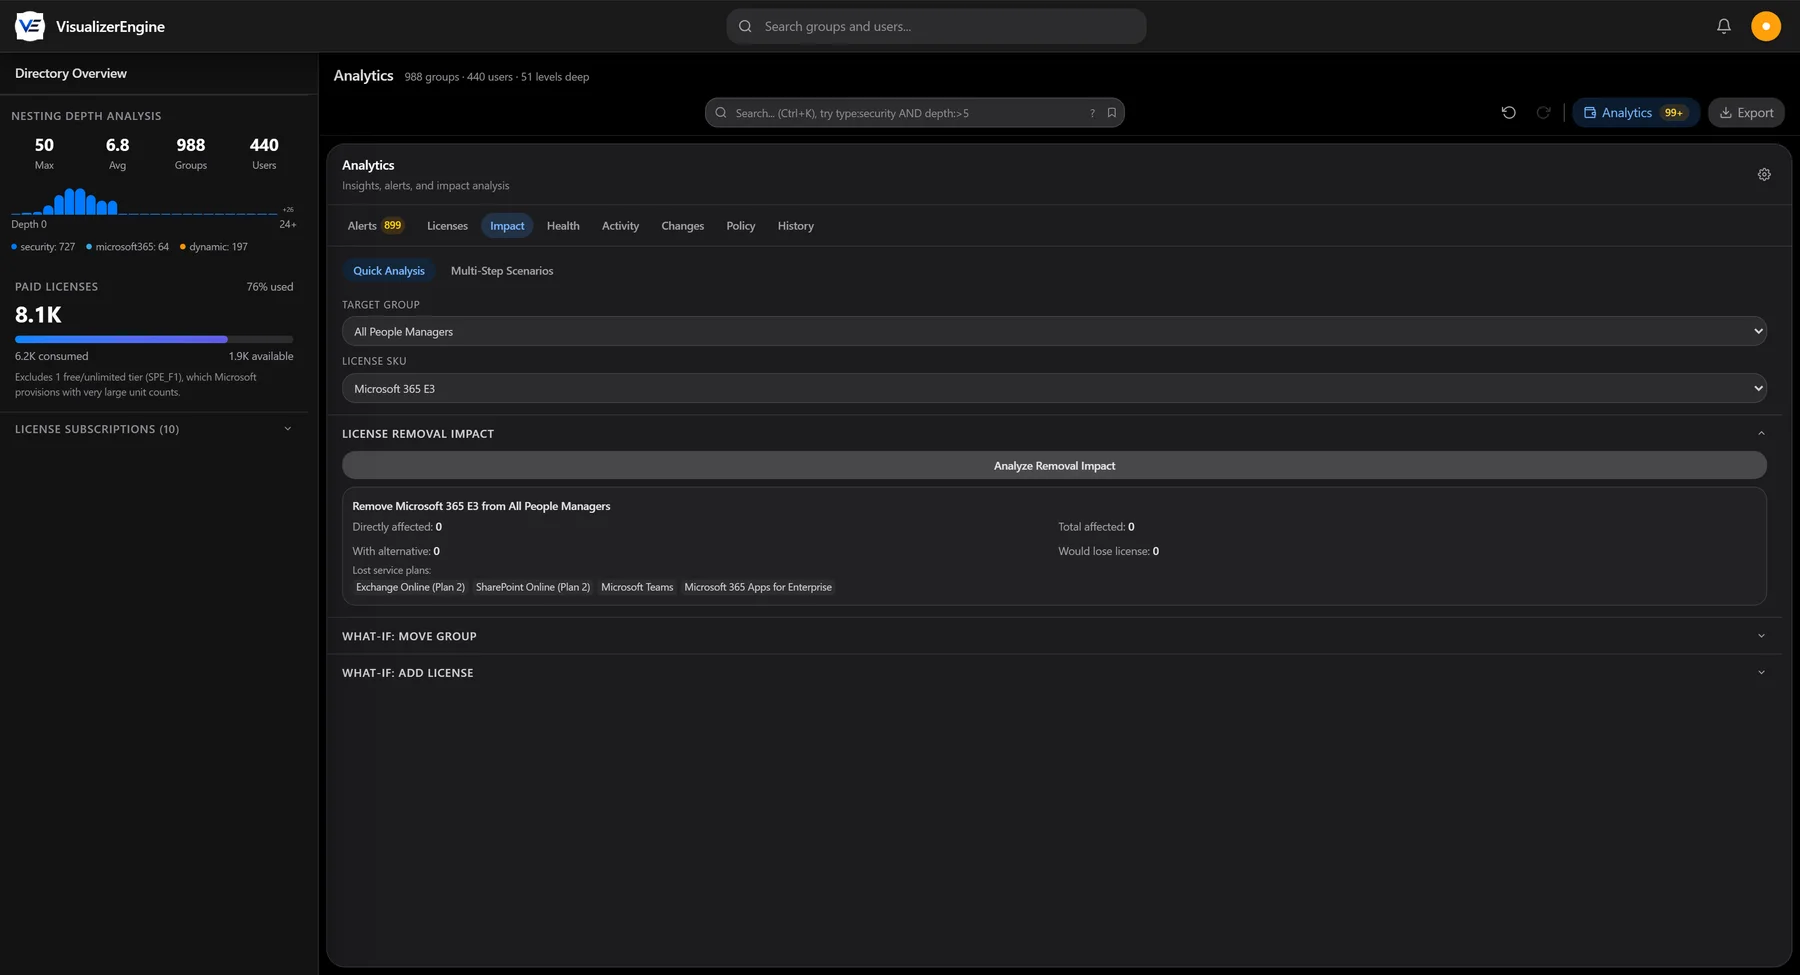
- Removal impact analysis. Before you unassign a license from a group, see exactly who would lose it and who is still covered by another source.
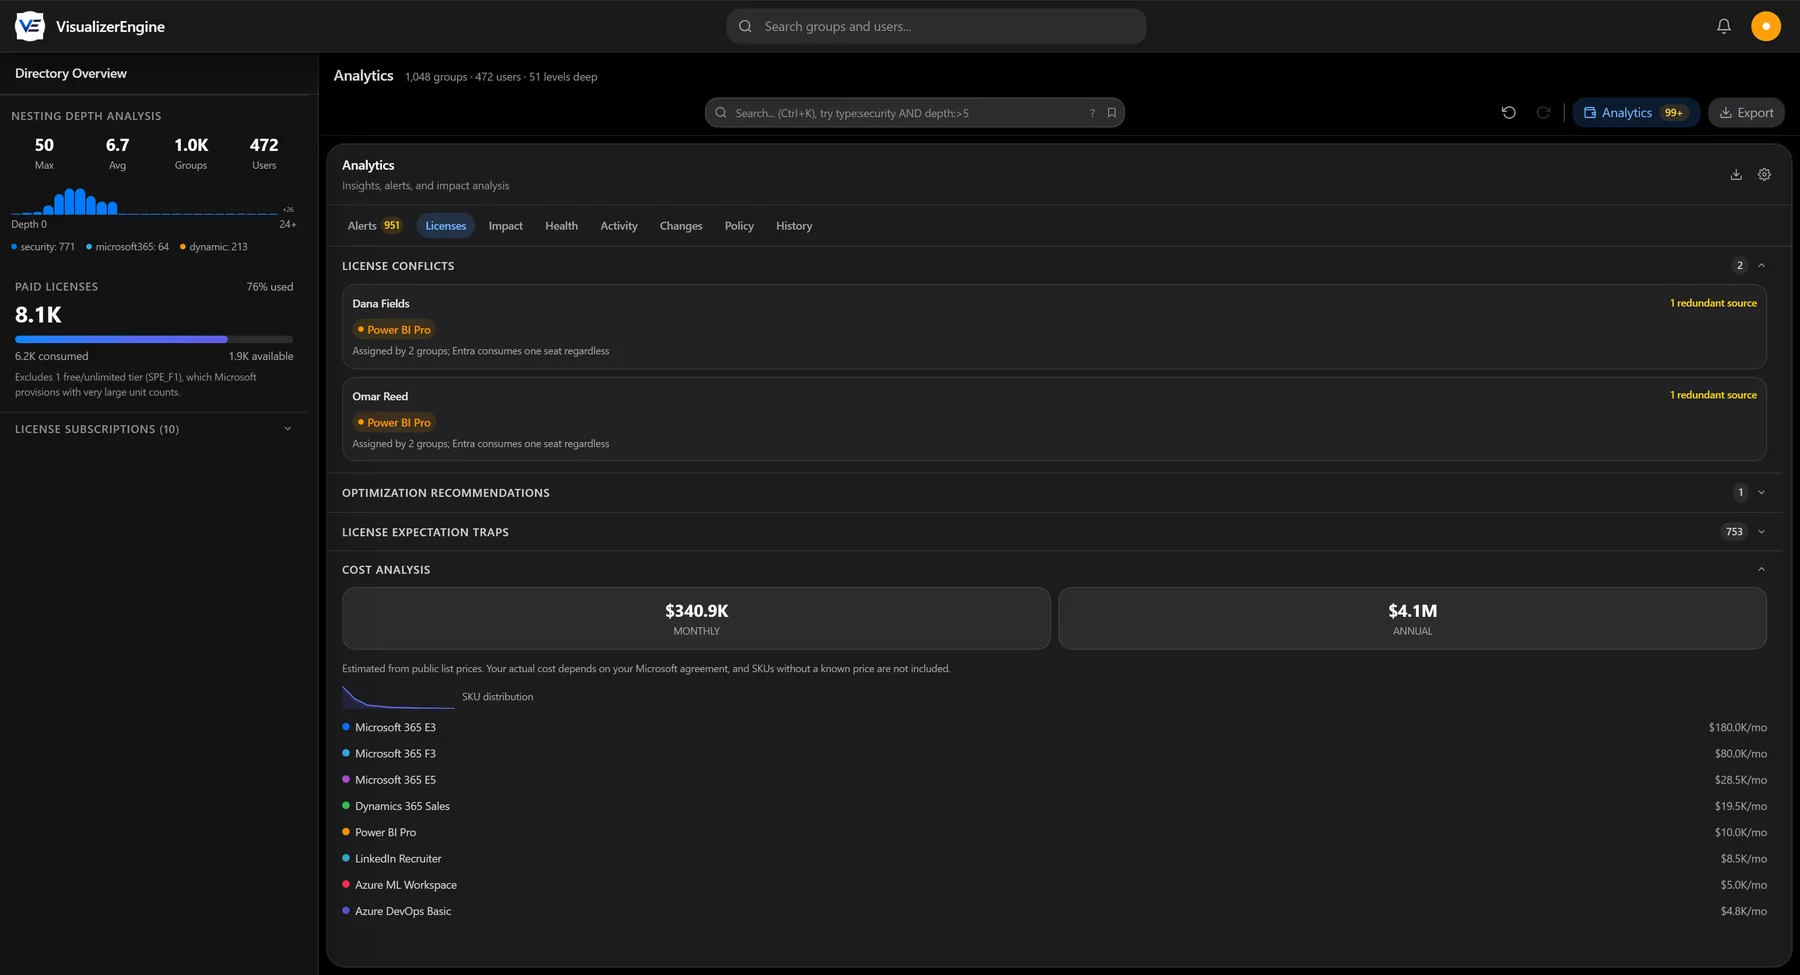
Simulate the change. See who loses access. Then decide.
Model a group move or a license change before touching the directory. Build multi-step scenarios, compare them side by side, and generate an ordered implementation plan.
Every simulation shows the full blast radius: who gains access, who loses it, and what happens to licensing, all without making a single change in production.
Governance as a trend you watch, not an audit you dread
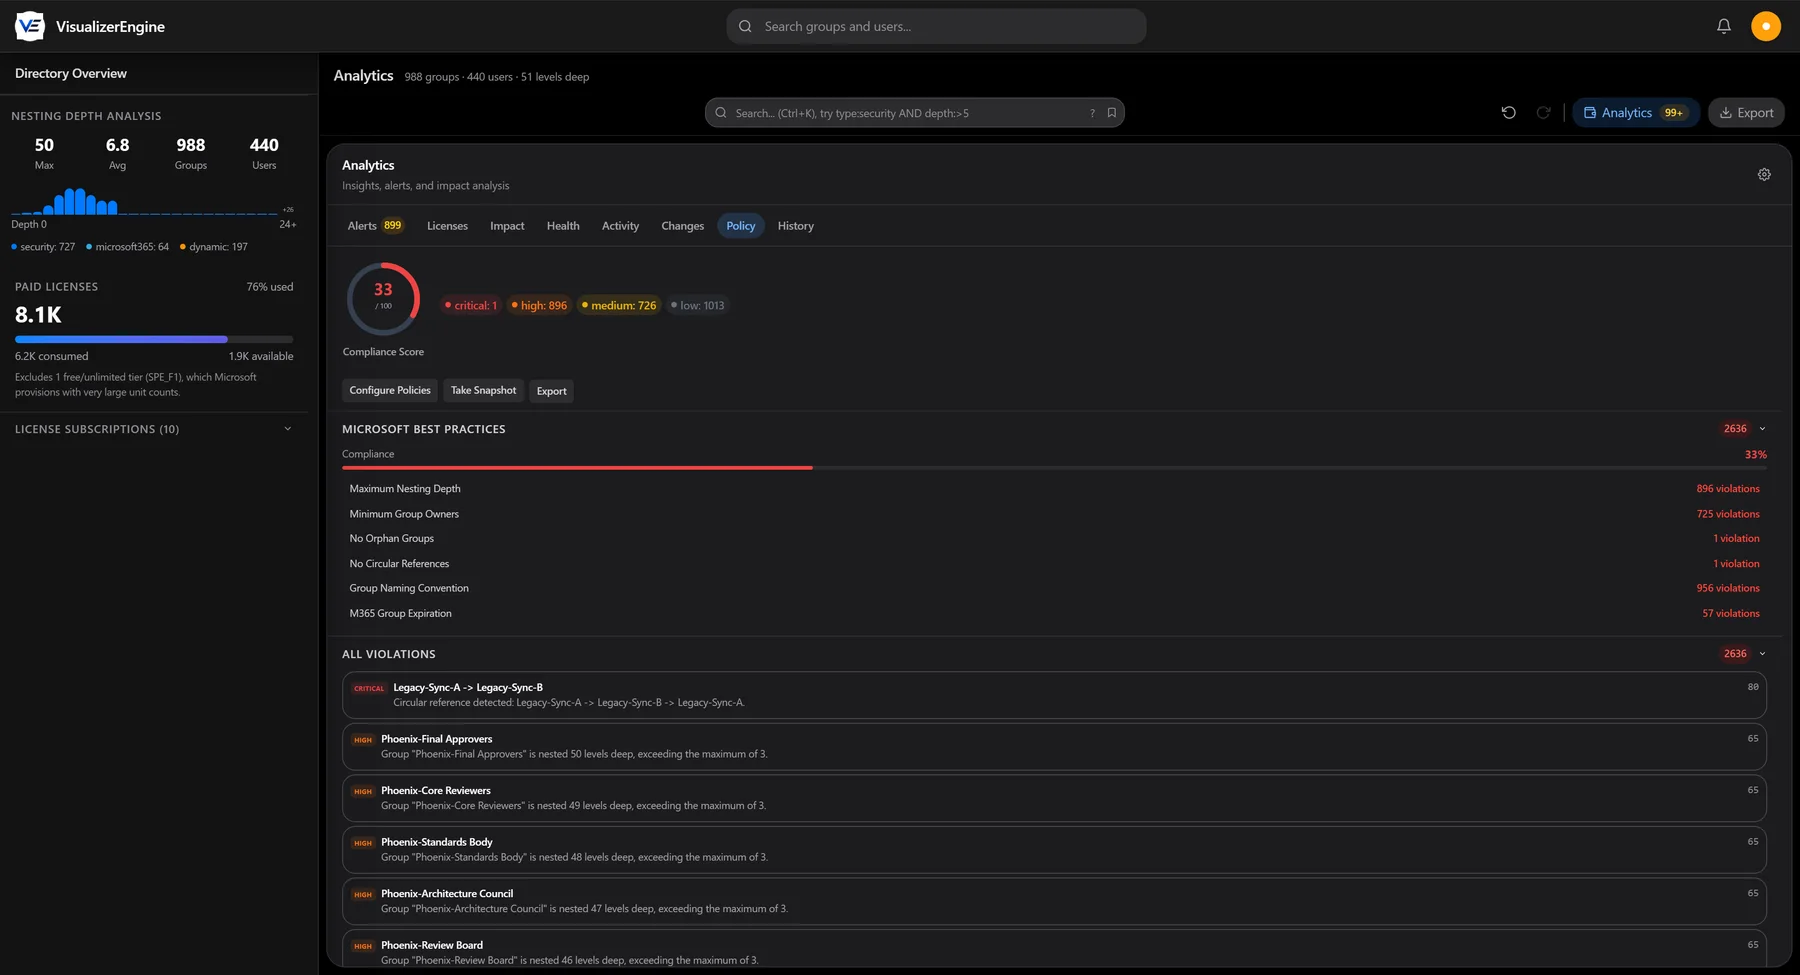
Encode your governance rules, such as maximum nesting depth and structural constraints, starting from templates or writing your own. VisualizerEngine scores every violation, computes a live compliance percentage, and plots how your compliance drifts over time.
Prove exactly what changed
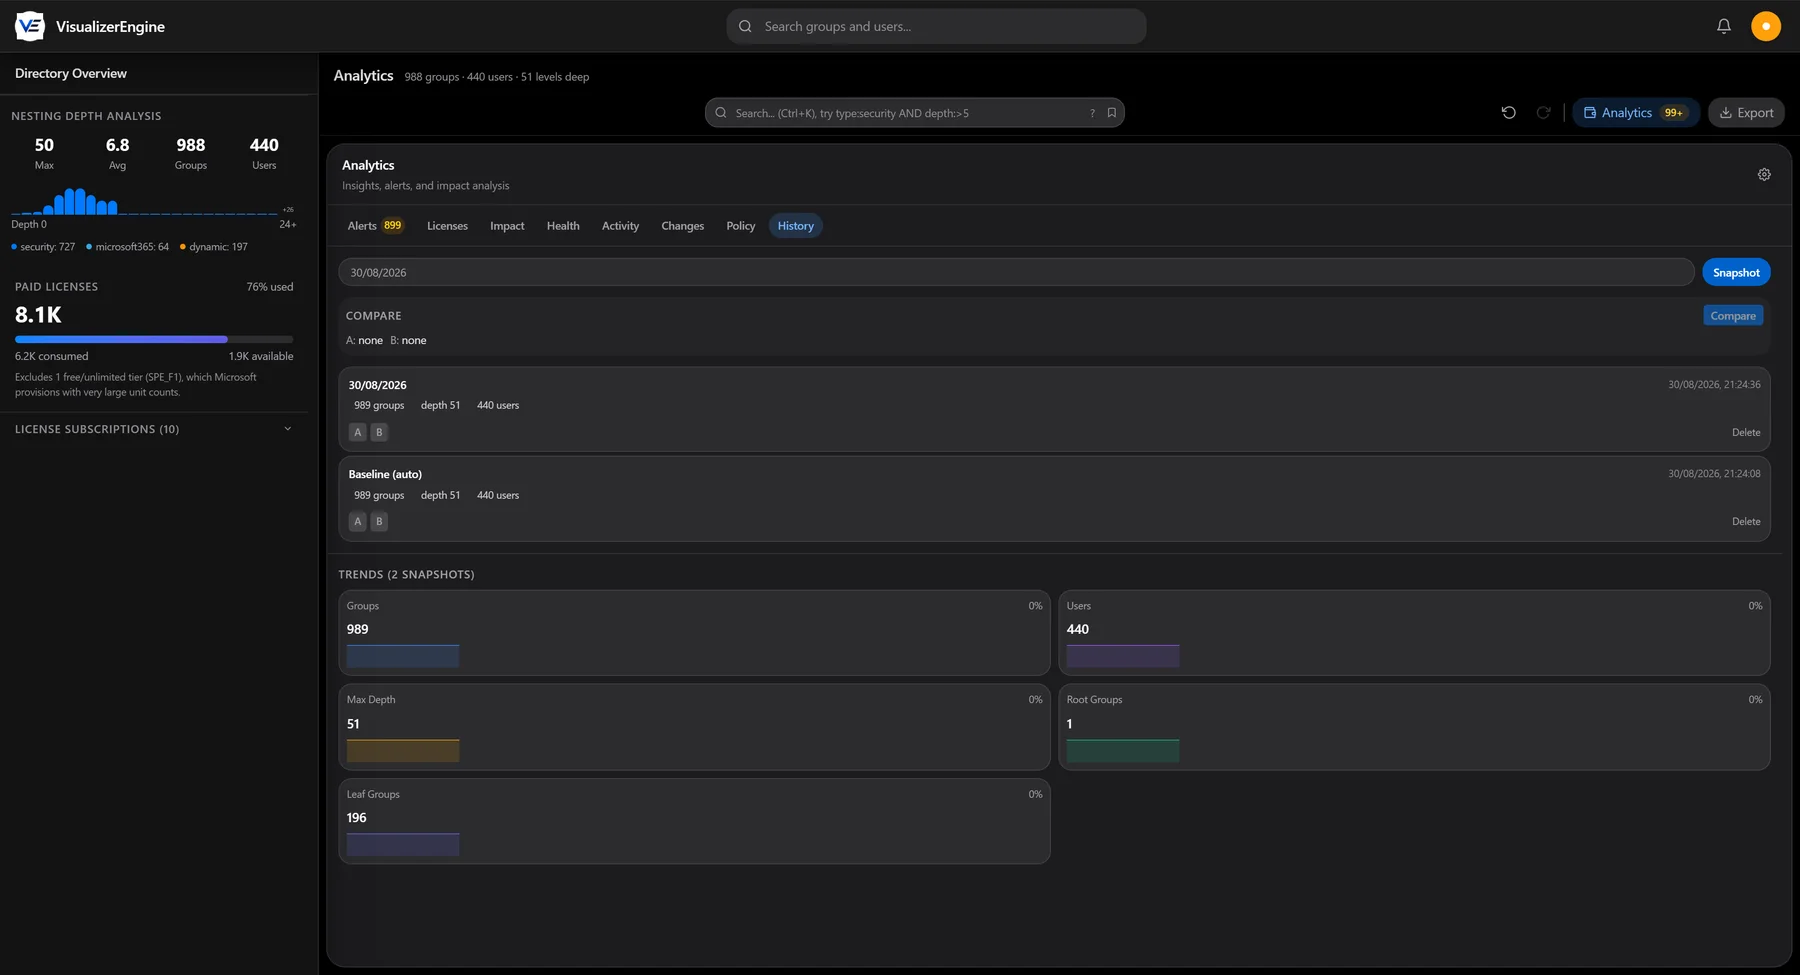
Capture point-in-time snapshots of your directory. Compare any two snapshots to see exactly what changed between them. Watch structural and license trends on a dashboard instead of reconstructing history from memory or old exports.
Search that understands structure
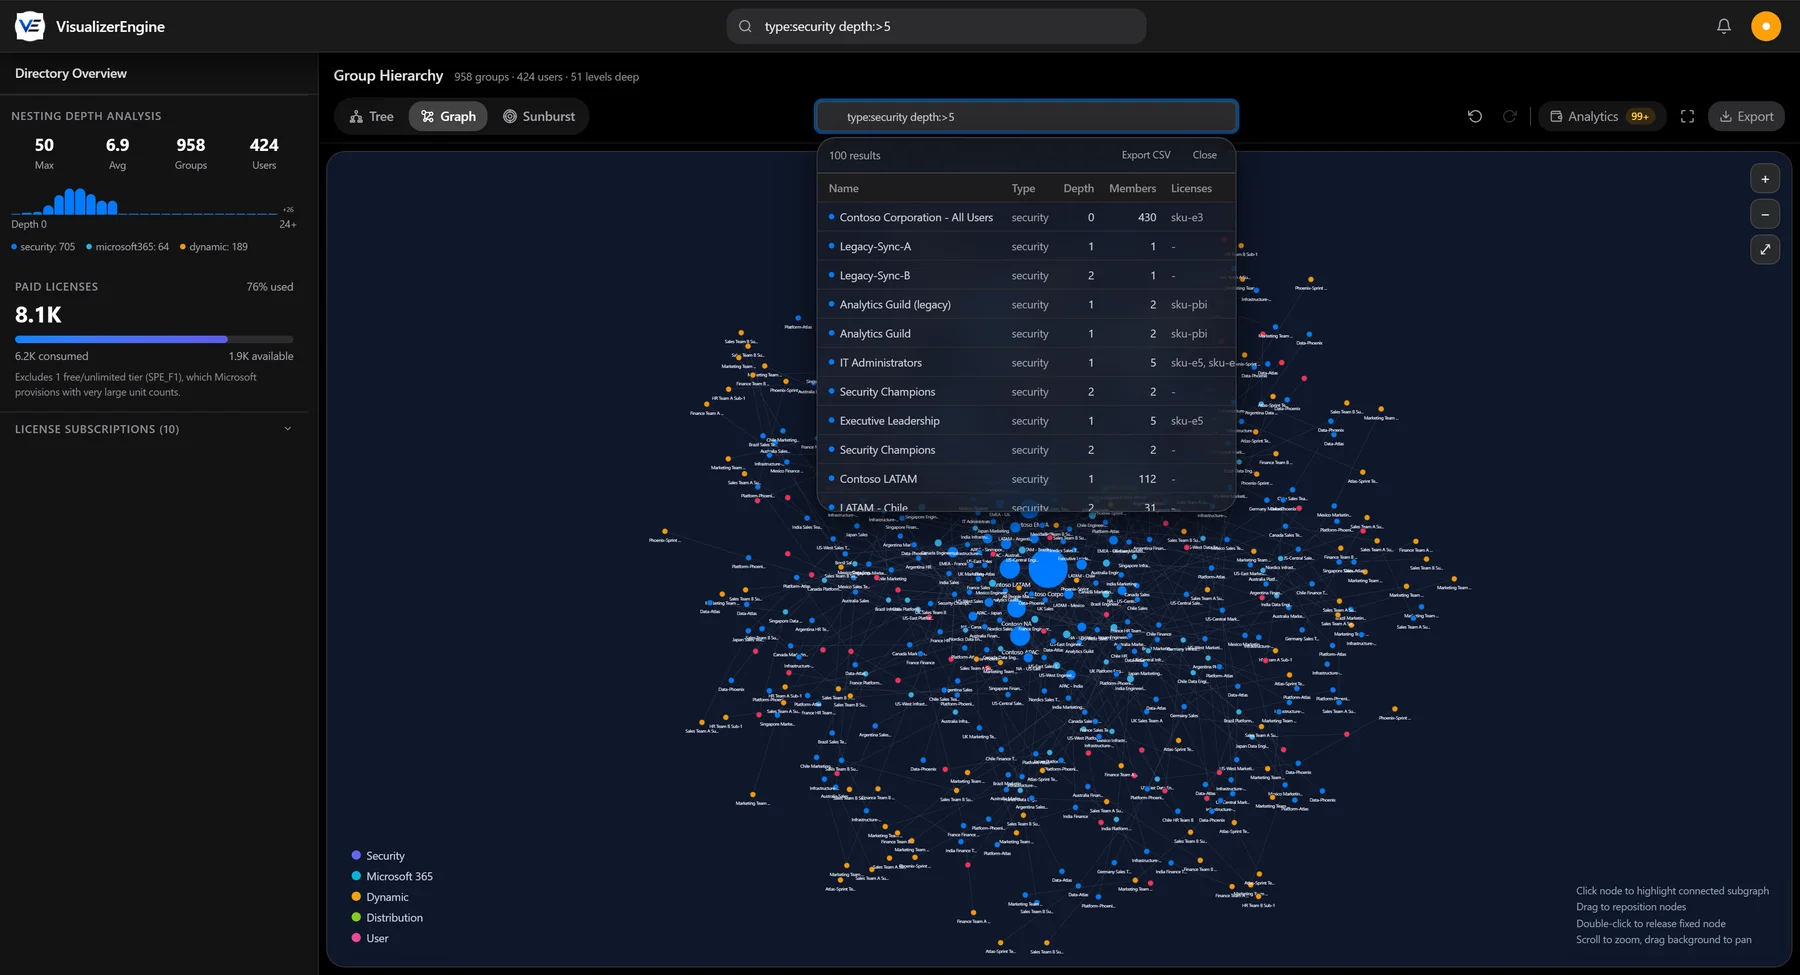
Query across groups, users, and memberships with a focused search language, and save the questions you find yourself asking every week so they are one click away next time.
Evidence you can hand to anyone
- CSV and JSON exports of the full hierarchy and every analytic.
- Branded PDF reports carrying your own logo and colors.
- Image exports of any visualization as PNG or SVG for slide decks and reviews.
- Compliance exports that carry provenance information and an integrity trailer, so any report can be traced back to the exact data that produced it.
The directory stops changing behind your back
A notification center with configurable alerts and a change-history view, so the directory stops changing behind your back and you learn about the changes that matter.
Trustworthy analytics admit what they do not know
When any part of the directory cannot be fully read, VisualizerEngine tells you plainly that the figures below are a lower bound, rather than quietly showing you numbers that are wrong.
Trustworthy analytics start with admitting what is not yet known, and this is built into every screen and every export.
See how everything connects.
Request early access to VisualizerEngine. Read-only onboarding, with no agents to install and no changes to your directory.